
Overview
An application team runs a small service on EC2 and wants request counts and availability visible in a shared dashboard. Instrument a local Python workload, scrape it with Prometheus, send metrics to Amazon Managed Service for Prometheus (AMP), and query them from Amazon Managed Grafana. No EKS cluster, Helm chart, access key file, or public application port is required.
Choose this pattern when an application already exposes Prometheus metrics and your team uses PromQL. CloudWatch is often a simpler starting point for standard EC2 infrastructure metrics; this project focuses on application instrumentation and the ingestion/query permission boundary. The service and collector are single-instance lab components, not a highly available monitoring platform. Expected results below must be verified in your own account.
Architecture
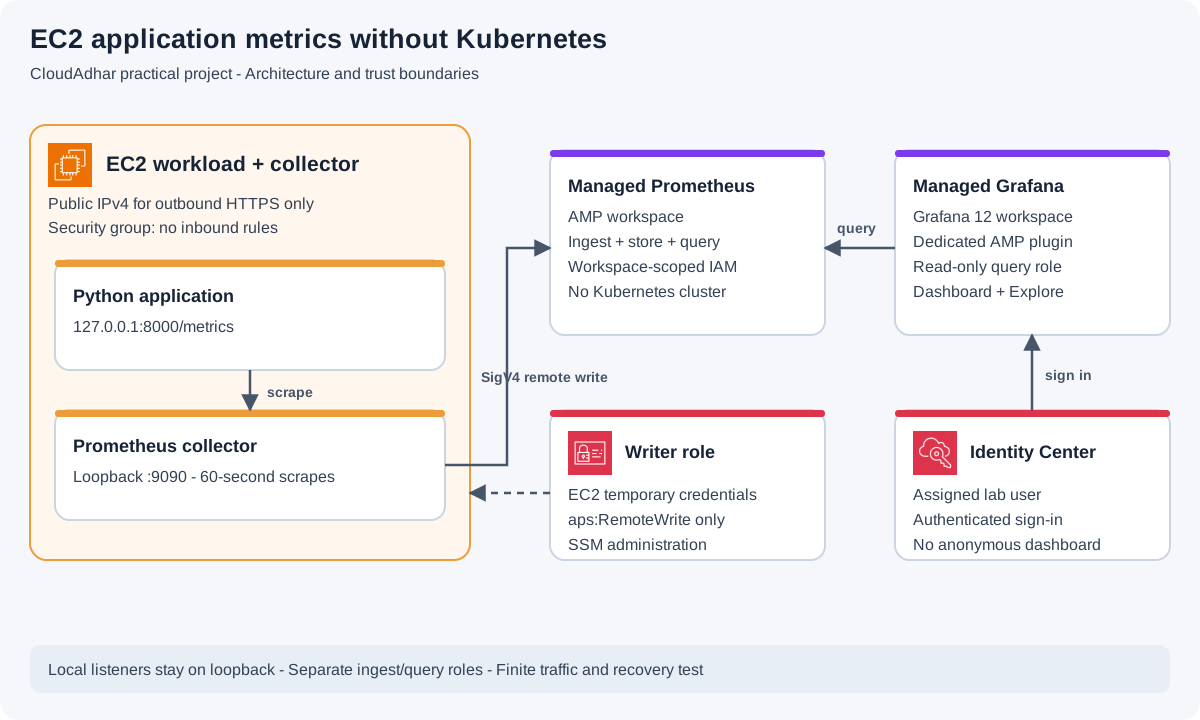
Open full-size architecture diagram
The EC2 role writes to one AMP workspace. The Grafana role can query that workspace but cannot ingest samples. Both use temporary credentials and signed HTTPS requests. Session Manager provides administration. For this cost-conscious lab, EC2 has a public IPv4 address for outbound access, an internet-gateway route, and no inbound security-group rules. Both the application and Prometheus listen only on loopback. An authenticated managed Grafana endpoint supplies the dashboard.
Prerequisites
- Complete account and budget setup, the VPC lab, and the Session Manager setup in the EC2 lab.
- Use one supported Region, such as
us-east-2, and an existing IAM Identity Center user. Enabling or changing organization-wide Identity Center is outside this project; an account administrator must prepare it first. - The provisioning operator needs AMP and Grafana workspace management, EC2 launch, dedicated IAM role/policy creation, and
iam:PassRolefor only the two lab roles. The operator assigning Grafana access also needs the relevant Identity Center permissions. - Budget for EC2, its public IPv4 address and EBS volume, AMP ingestion/storage/queries, and an active Grafana user. Managed Grafana user billing is not an hourly EC2-style meter; inspect its pricing before assigning yourself.
Steps
1. Create the metric destination and writer role
In Amazon Managed Service for Prometheus → Create workspace, use alias ca-ec2-metrics. Wait for Active. Record its ARN and remote write URL. Keep the Region consistent throughout the exercise.
In IAM → Roles → Create role, select AWS service → EC2 and name the role ca-metrics-ec2-role. Attach AmazonSSMManagedInstanceCore. Add this inline policy, replacing the complete example ARN with your workspace ARN:
{
  "Version": "2012-10-17",
  "Statement": [{
    "Effect": "Allow",
    "Action": "aps:RemoteWrite",
    "Resource": "arn:aws:aps:us-east-2:123456789012:workspace/ws-REPLACE"
  }]
}
The collector needs no AMP query permission. AWS documents EC2 remote write with native SigV4 support, so this design does not need the Kubernetes service-account mechanism in older EKS examples. EC2 remote write setup
2. Launch a host with no inbound access
Create security group ca-metrics-sg in your lab VPC. Remove inbound rules. Replace default outbound access with HTTPS TCP 443 → 0.0.0.0/0. VPC DNS resolution must be enabled. Use the default network ACL for this exercise.
Launch ca-metrics-host using the current Amazon Linux 2023 x86_64 AMI, t3.small, and a 20 GiB encrypted gp3 root volume with delete-on-termination enabled. Choose the lab public subnet, enable public IPv4 assignment, select no key pair, attach ca-metrics-sg, and select ca-metrics-ec2-role as the instance profile. Require IMDSv2. Do not enable detailed EC2 monitoring for this exercise.
Wait for status checks and Session Manager availability. Connect through EC2 → Connect → Session Manager, then start a root shell for the installation commands:
sudo -i
dnf install -y python3 tar gzip
useradd --system --no-create-home --shell /sbin/nologin ca-metrics
useradd --system --no-create-home --shell /sbin/nologin prometheus
install -d -m 755 /opt/ca-metrics /etc/prometheus
install -d -o prometheus -g prometheus -m 750 /var/lib/prometheus
3. Instrument an original sample service
Create /opt/ca-metrics/app.py:
cat > /opt/ca-metrics/app.py <<'PY'
from http.server import BaseHTTPRequestHandler, HTTPServer
from time import monotonic

started = monotonic()
requests = 0

class Handler(BaseHTTPRequestHandler):
    def do_GET(self):
        global requests
        if self.path == "/metrics":
            body = (
                "# HELP cloudadhar_requests_total Successful application requests.\n"
                "# TYPE cloudadhar_requests_total counter\n"
                f"cloudadhar_requests_total {requests}\n"
                "# HELP cloudadhar_uptime_seconds Time since application start.\n"
                "# TYPE cloudadhar_uptime_seconds gauge\n"
                f"cloudadhar_uptime_seconds {monotonic() - started:.3f}\n"
            )
            content_type = "text/plain; version=0.0.4; charset=utf-8"
        elif self.path == "/":
            requests += 1
            body, content_type = "CloudAdhar metrics lab\n", "text/plain"
        else:
            self.send_error(404)
            return
        payload = body.encode("utf-8")
        self.send_response(200)
        self.send_header("Content-Type", content_type)
        self.send_header("Content-Length", str(len(payload)))
        self.end_headers()
        self.wfile.write(payload)

    def log_message(self, format, *args):
        pass

HTTPServer(("127.0.0.1", 8000), Handler).serve_forever()
PY

cat > /etc/systemd/system/ca-metrics.service <<'UNIT'
[Unit]
Description=CloudAdhar sample metrics workload
After=network.target
[Service]
User=ca-metrics
ExecStart=/usr/bin/python3 /opt/ca-metrics/app.py
Restart=on-failure
NoNewPrivileges=true
ProtectSystem=strict
ProtectHome=true
[Install]
WantedBy=multi-user.target
UNIT
systemctl daemon-reload
systemctl enable --now ca-metrics
curl -fsS http://127.0.0.1:8000/metrics
Expect a zero request counter and a positive uptime. Scrapes do not increment the application request counter. There are no per-user or URL labels; bounded cardinality keeps this small exercise predictable.
4. Install and configure the collector
The following pin uses Prometheus 3.14.0, a stable release listed on the official download page when this guide was reviewed. Verify the checksum before installation; if using another version, obtain its matching checksum rather than reusing this one. Official downloads
cd /tmp
curl -fLO https://github.com/prometheus/prometheus/releases/download/v3.14.0/prometheus-3.14.0.linux-amd64.tar.gz
printf '%s  %s\n' \
  'f665c6da19eb7ba399c915d30c7d9793c9b417bf8a749b504bc470678631478d' \
  'prometheus-3.14.0.linux-amd64.tar.gz' | sha256sum -c -
Continue only if the checksum prints OK:
tar -xzf prometheus-3.14.0.linux-amd64.tar.gz
install -m 755 prometheus-3.14.0.linux-amd64/prometheus /usr/local/bin/prometheus
install -m 755 prometheus-3.14.0.linux-amd64/promtool /usr/local/bin/promtool
Using vi /etc/prometheus/prometheus.yml, save this configuration with your exact remote-write URL and Region. The URL ends with /api/v1/remote_write; do not use the query endpoint here.
global:
  scrape_interval: 60s
  external_labels:
    environment: cloudadhar-lab
scrape_configs:
  - job_name: cloudadhar-app
    static_configs:
      - targets: ['127.0.0.1:8000']
remote_write:
  - url: https://aps-workspaces.us-east-2.amazonaws.com/workspaces/ws-REPLACE/api/v1/remote_write
    sigv4:
      region: us-east-2
Validate the file and create the service:
promtool check config /etc/prometheus/prometheus.yml
cat > /etc/systemd/system/prometheus.service <<'UNIT'
[Unit]
Description=CloudAdhar Prometheus collector
Wants=network-online.target
After=network-online.target
[Service]
User=prometheus
Group=prometheus
ExecStart=/usr/local/bin/prometheus --config.file=/etc/prometheus/prometheus.yml --storage.tsdb.path=/var/lib/prometheus --storage.tsdb.retention.time=2h --storage.tsdb.retention.size=256MB --web.listen-address=127.0.0.1:9090
Restart=on-failure
NoNewPrivileges=true
ProtectSystem=strict
ProtectHome=true
ReadWritePaths=/var/lib/prometheus
[Install]
WantedBy=multi-user.target
UNIT
systemctl daemon-reload
systemctl enable --now prometheus
curl -fsS http://127.0.0.1:9090/-/ready
journalctl -u prometheus --since '5 minutes ago' --no-pager
Readiness confirms the local collector is ready, not that remote ingestion succeeded. Allow at least two scrape intervals, then inspect its log for authentication or remote-write failures.
5. Give Grafana read-only access
Create IAM role ca-grafana-query-role using Custom trust policy. Replace account and Region below. The initial workspace wildcard lets you create the workspace; tighten it afterward.
{
  "Version": "2012-10-17",
  "Statement": [{
    "Effect": "Allow",
    "Principal": {"Service": "grafana.amazonaws.com"},
    "Action": "sts:AssumeRole",
    "Condition": {
      "StringEquals": {"aws:SourceAccount": "123456789012"},
      "ArnLike": {"aws:SourceArn": "arn:aws:grafana:us-east-2:123456789012:/workspaces/*"}
    }
  }]
}
Attach this inline permission policy with the same AMP workspace ARN used by the writer:
{
  "Version": "2012-10-17",
  "Statement": [{
    "Effect": "Allow",
    "Action": ["aps:QueryMetrics", "aps:GetLabels", "aps:GetSeries", "aps:GetMetricMetadata"],
    "Resource": "arn:aws:aps:us-east-2:123456789012:workspace/ws-REPLACE"
  }]
}
In Amazon Managed Grafana → Create workspace, name it ca-ec2-observability, select Grafana version 12, IAM Identity Center authentication, and Customer managed permissions. Use this query role as the workspace IAM role; configure it in workspace permission settings if the wizard requests it after creation. Leave VPC attachment and enterprise upgrades off. AMP is an AWS managed endpoint, so this setup does not need access to EC2's loopback listener.
Once the workspace is active, copy its ARN. Replace the trust policy's wildcard ARN with this exact ARN. Under workspace Authentication, assign only your lab user and give that user Admin access for dashboard setup. Open the workspace URL and sign in. Workspace creation, trust policy protection
6. Connect the dashboard and exercise the workload
In Grafana, choose Connections → Add new connection → Amazon Managed Service for Prometheus → Add new data source. Name it ca-amp. Use your workspace base URL ending /workspaces/ws-..., without /api/v1/query. Select AWS SDK Default credentials, your Region, and service aps; leave access keys, assume-role ARN, and external ID empty. Set the scrape interval to 60s, disable rule/alert management for this read-only exercise, and choose Save & test.
Grafana 12 uses the dedicated AMP plugin; its authentication differs from old core-Prometheus screenshots. Manual configuration also avoids granting discovery permission across every workspace. Current AMP plugin, plugin settings
In the EC2 Session Manager terminal, generate a finite amount of traffic:
for n in $(seq 1 20); do curl -fsS http://127.0.0.1:8000/ > /dev/null; done
curl -fsS http://127.0.0.1:8000/metrics
With no earlier requests, the local counter should be 20. In Grafana Explore, select ca-amp and query cloudadhar_requests_total. Wait for ingestion, then create a dashboard named EC2 application health with these three panels:
| Panel | PromQL | Expected behavior |
|---|---|---|
| Scrape health | up{job="cloudadhar-app"} | 1 while the workload is reachable |
| Requests since process start | cloudadhar_requests_total | At least 20 after test traffic |
| Recent requests per second | rate(cloudadhar_requests_total[5m]) | Reflects traffic after enough samples exist |
Use a 15-minute time range and 60-second refresh. Stop only the sample workload with systemctl stop ca-metrics. After the next scrape is ingested, up should become 0; the collector must remain running for this check. Restart it with systemctl start ca-metrics and confirm recovery to 1. The application's in-memory counter resets on restart; rate handles counter resets, whereas the raw counter is not an all-time business total.
Troubleshooting
- No SSM connection: check instance profile, public IPv4, internet-gateway route, DNS, and outbound HTTPS. Do not open SSH to diagnose it.
- Remote write 403: compare Region, workspace ID, EC2 role, and exact
aps:RemoteWriteresource ARN. Confirm the machine clock is synchronized. - Grafana 403: check its separate role, exact workspace trust ARN, and query permissions. The EC2 writer role is not a query role.
- Save & test works but no series: inspect local
/metrics,promtooloutput, collector logs, time range, and scrape job name. Connection health does not prove samples arrived. - No rate yet: collect several 60-second samples and send another small burst. Avoid adding unbounded labels or one-second scraping to force a result.
Verification
- No inbound rules exist on the EC2 security group, and
ss -lntshows ports 8000 and 9090 bound to127.0.0.1. - Remote-write logs have no unresolved delivery errors; Grafana displays the actual request counter from this workload.
- Stopping and restarting the application produces a visible
uptransition while Prometheus stays running. - Save a dashboard export and a screenshot with the workspace, instance ID, test time, and observed values. Do not include credentials.
Cost and cleanup
Review AMP pricing and Grafana pricing alongside EC2, EBS, and public IPv4 charges. Grafana charges depend on active user roles; deleting a workspace does not undo usage already incurred. Low metric cardinality and a 60-second interval limit ingestion, but the project is not guaranteed free.
Stop the writer first: systemctl stop prometheus ca-metrics. Delete the dedicated Grafana workspace and AMP workspace, accepting deletion of their lab data. Terminate the dedicated EC2 instance and verify its root volume was deleted; remove any retained lab volumes or snapshots. Delete ca-metrics-sg, remove both lab IAM roles and inline policies, and remove their instance profile if it remains. Keep shared Identity Center users, the shared VPC, and unrelated roles. Confirm both managed workspaces are gone and no lab instance or volume remains.
References
Official documentation reviewed on 23 September 2026: